The modes
Each mode is a different way to make a figure — all exporting to the same publication-ready PNG, PDF, or SVG.
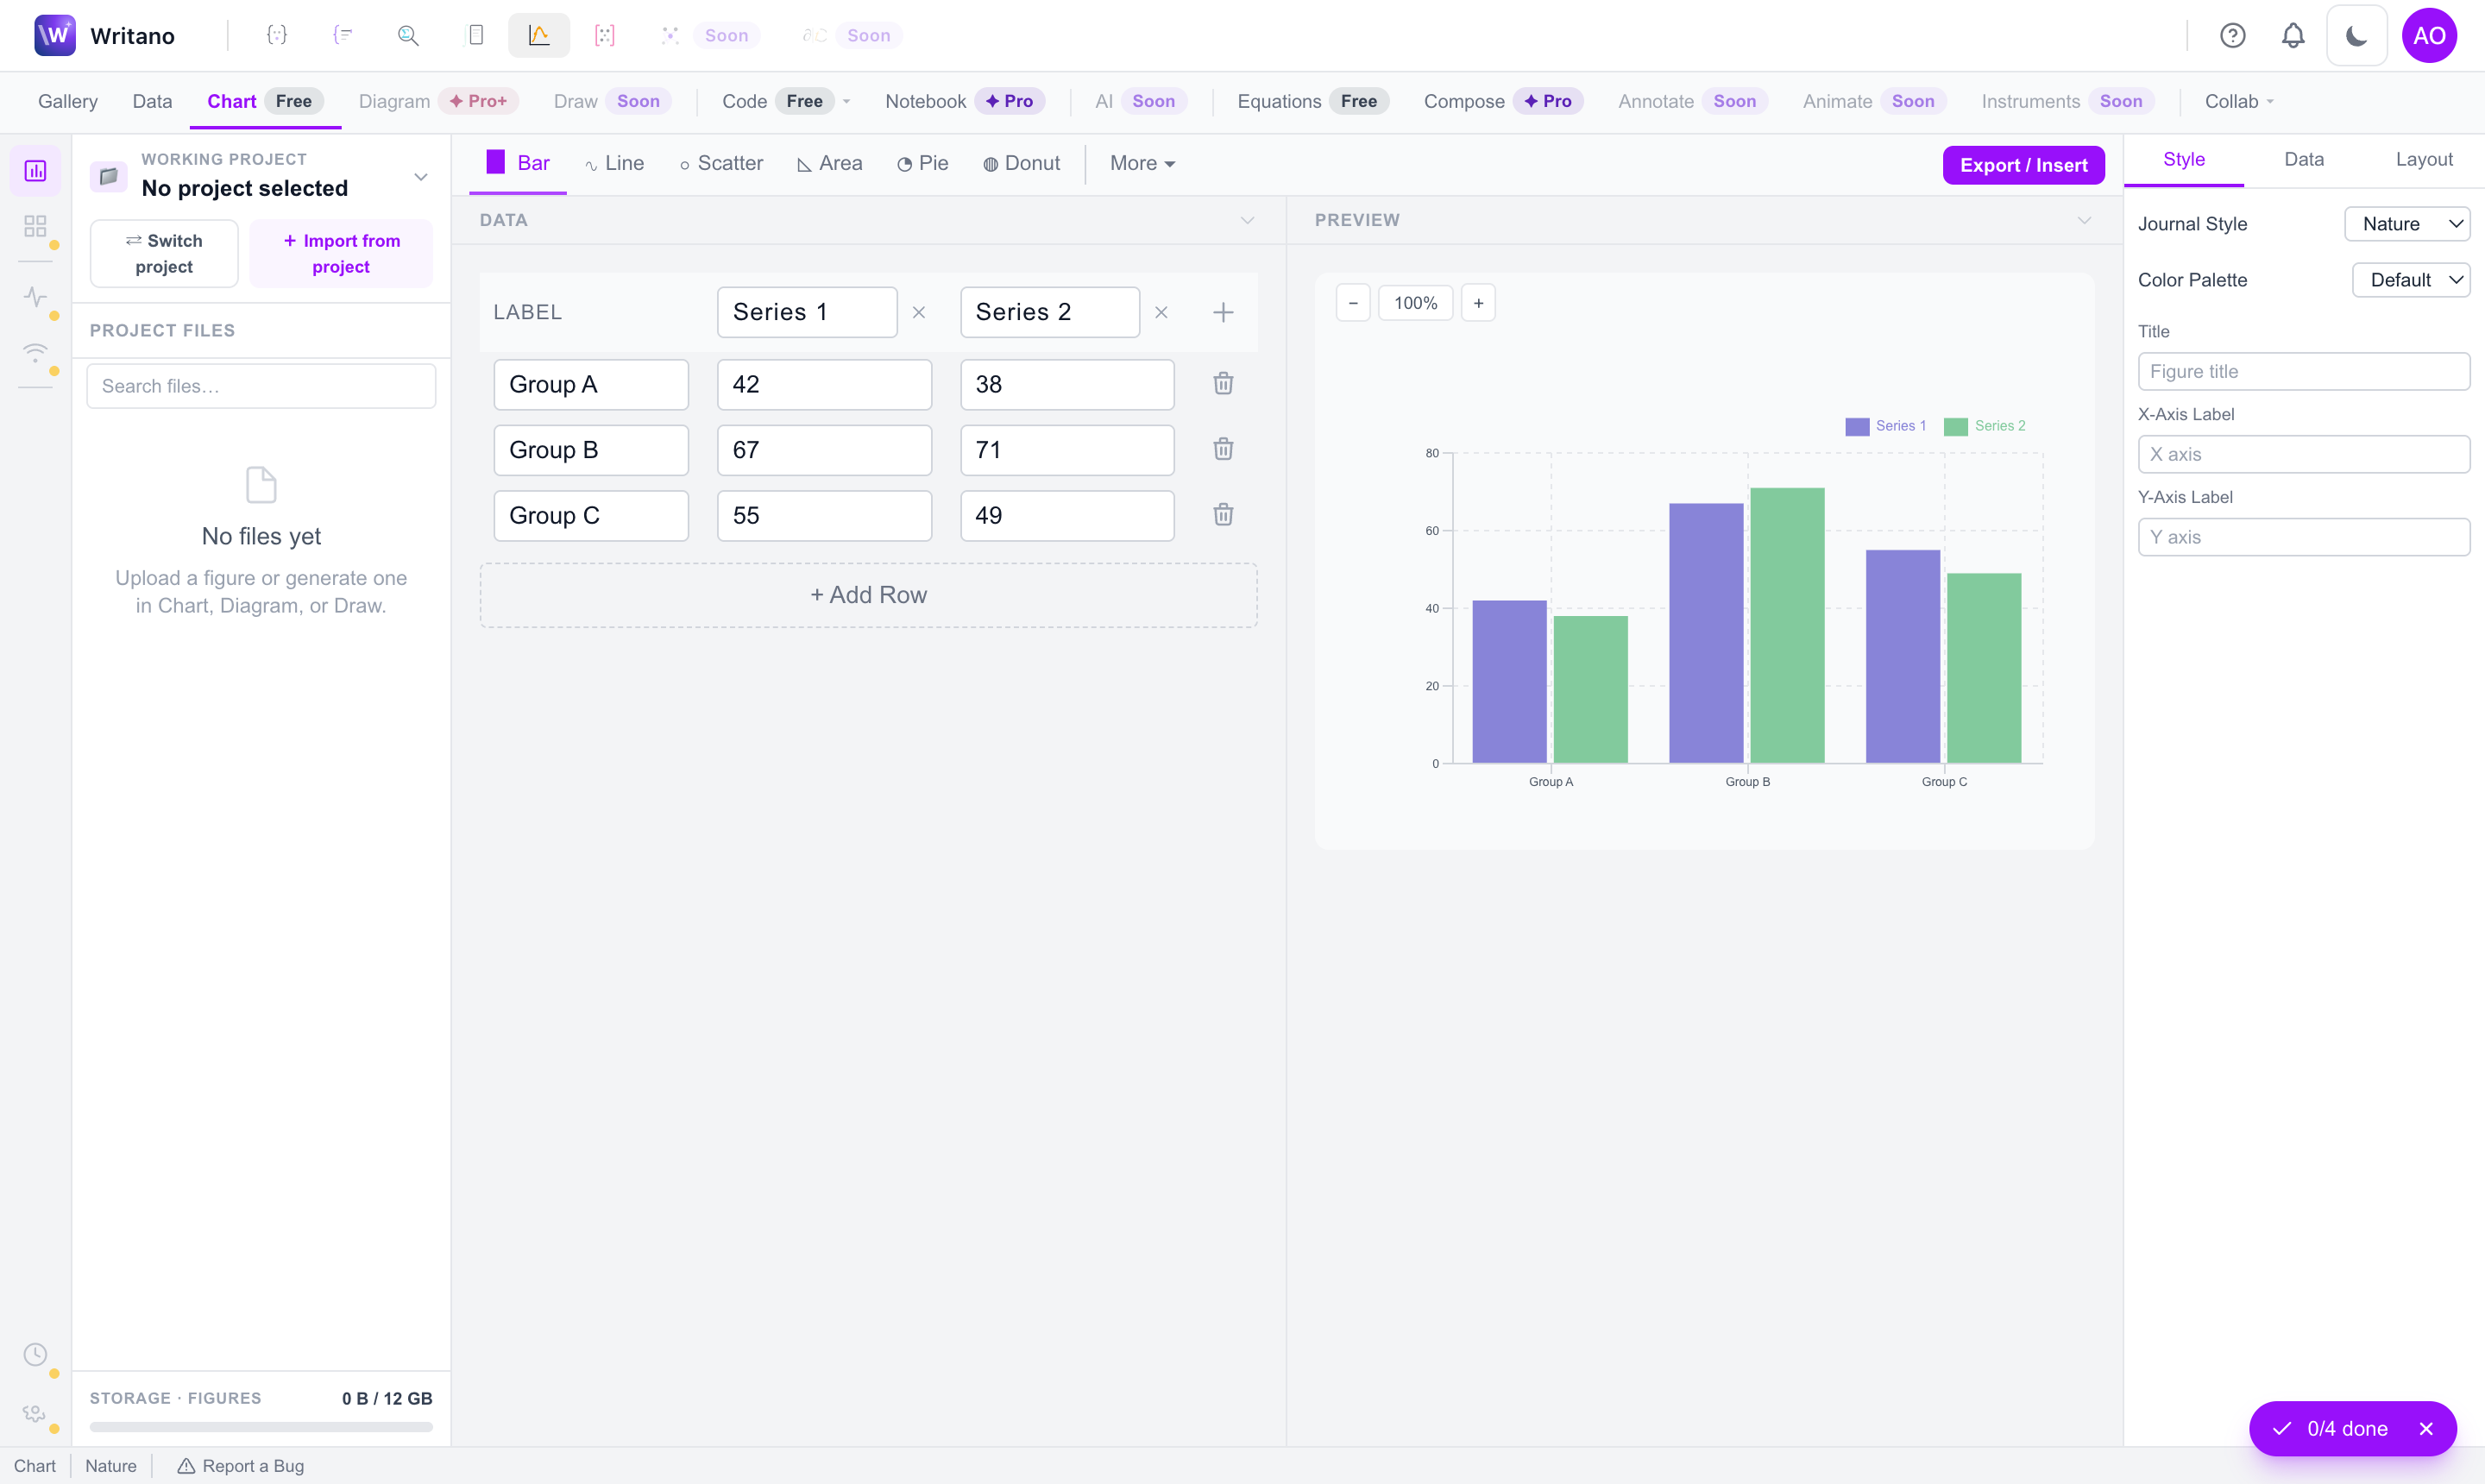
Chart Free
14 chart types from a data table — bar, line, scatter, area, pie, plus histogram, box, violin, heatmap and more.
Data Free
Import CSV / Excel / JSON, then curve-fit, run statistics, signal-process, or transform before charting.
Diagram Pro+
Flowcharts, sequence, ER, mindmaps and more from a text description.
Code Free
Write Python / matplotlib, JavaScript / Plotly, R / ggplot2, or Gnuplot — runs in your browser.
Compose Pro
Arrange several figures into a labelled multi-panel figure with sub-captions.
Annotate Free
Arrows, labels, callouts and review comments on any image — synced with collaborators.
Data & charts
Drop a CSV, Excel, or JSON file into the Data tab and Writano parses it — showing real row and column counts — then Use in Chart sends it to the builder. The Pro sub-tabs (Curve Fitting, Statistics, Signal Processing) analyse the same dataset.
Exporting a figure
Hit Export / Insert to save a figure to your project, download it, or drop the \includegraphics straight into your paper. Saved figures reopen for editing — a chart comes back in the builder with its data intact.